 ExcelFrog
Clear Excel Tutorials
ExcelFrog
Clear Excel Tutorials
Note: if you are looking for a freelancer to build a custom financial model for your business, I'm available. Learn more here.
In our previous tutorial, we learned the concept of problem-solving modelling. Today, we're stepping into a more advanced realm, financial modelling in Excel, with a real-life example.
Before we start, you can download the Excel model by clicking this link. It contains 3 tabs: Inputs, Calculations, and Outputs, that we will cover below.
You're interested in investing in real estate: buying an apartment and renting it out. Is it a profitable investment? How much do you need to invest? Real estate investment is exciting, but it can be tricky to navigate the financial aspects.
To make an informed decision, you want to forecast your cash flows and understand your potential returns. The financial model we're introducing here will help you do just that. Let's see how it works!
We start by defining our investment assumptions in the Inputs tab. Here is the data you either have at hand or can make educated guesses about.
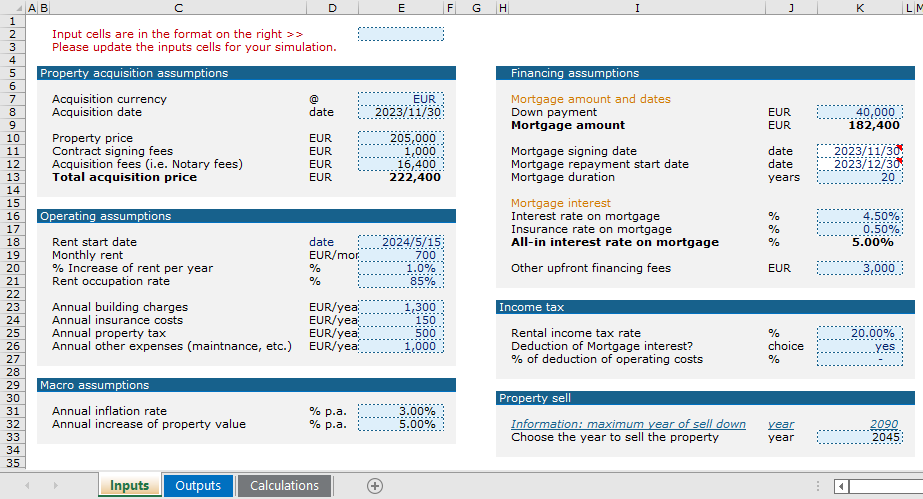
For our scenario, the main inputs you need to set are:
Fill in the inputs based on your specific situation or projections. The better your estimates, the more reliable the results.
So, how do we turn these inputs into meaningful information?
Now, let's move onto the Calculations tab, which is essentially the powerhouse of our model.
The entire tab is automatically calculated and updated based on the assumptions you provided. The goal of this tab is to break down complex computations into intermediary steps.
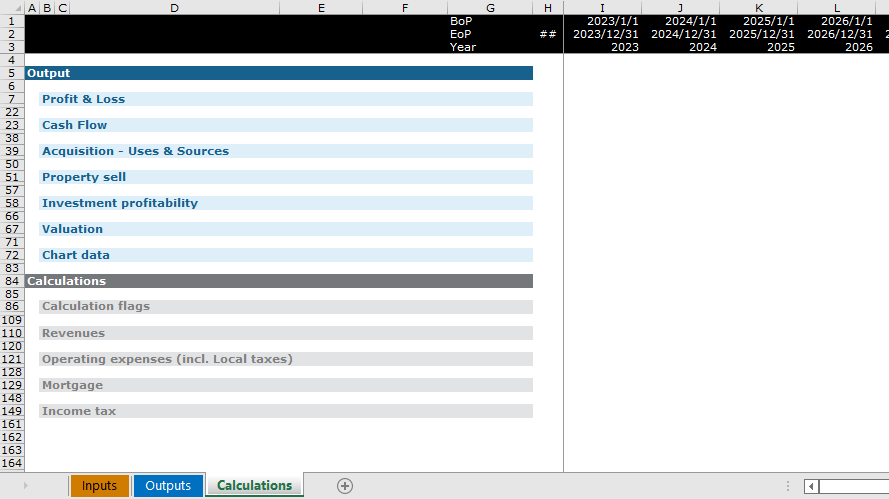
There are different computation modules, each dedicated to calculating a specific aspect of the real estate investment, such as revenues, operating expenses, mortgage, tax, and more. You can find the the intermediary results at the top of the tab.
If you are curious about the magic that makes these calculations work, we're crafting a series of tutorials that will open up each module for you.
The Outputs tab is possibly the most sought-after section of our financial model. It contains a dashboard revealing the details of your real estate investment performance.
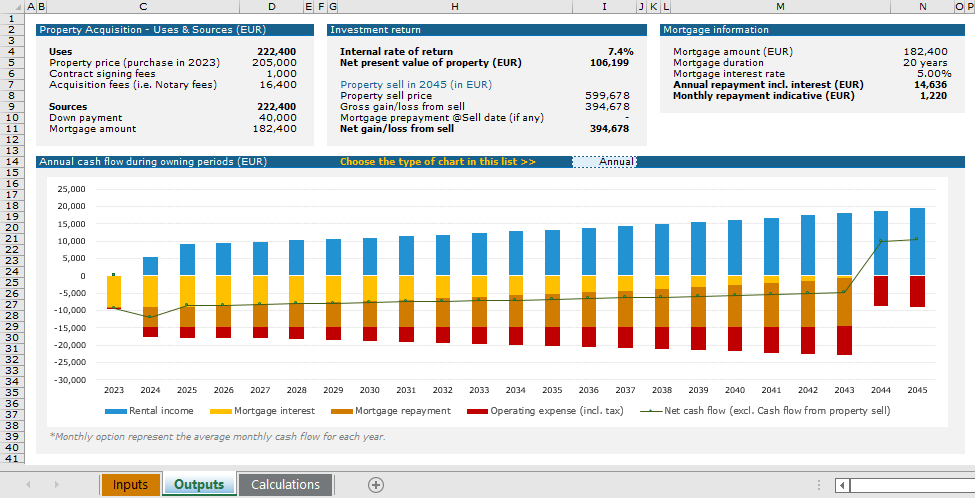
Here you can explore four key aspects of your investment:
This dashboard is customizable, look out for our upcoming tutorials with tips on how to personalize it.
By adjusting the inputs, you can simulate different scenarios and see how they affect your potential returns. This is a powerful way to plan and prepare for a variety of outcomes.
Once you've entered the inputs, the calculations and outputs update automatically, allowing you to easily adjust and test different scenarios.
Before we conclude, it's important to be aware of the limitations of this model:
By breaking down the problem into inputs, intermediary calculations, and outputs, real estate investment analysis becomes far more manageable. With the help of this model, you can confidently navigate your real estate investment journey.
Don't forget to download the model for yourself and start exploring. Stay tuned, keep learning, and happy investing!