 ExcelFrog
Clear Excel Tutorials
ExcelFrog
Clear Excel Tutorials
There are some Microsoft Excel features that are awesome but somewhat hidden. And the "data table analysis" is one of them.
Sometimes a formula depends on multiple inputs, and you'd like to see how different inputs values would impact the result. The data table is perfect for that situation.
This is extremely useful to analyze a problem in Excel and figure out the best solution.
To use the data table feature we will need some data.
Here's a table with 2 inputs (book price and quantity sold), and a formula (revenue = price * quantity).
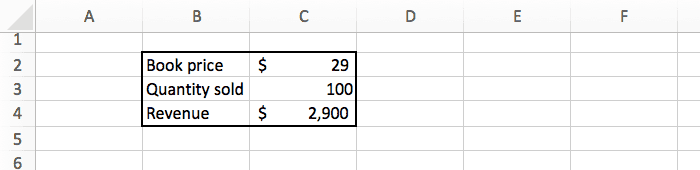
If we sell 100 books at $29 each, we will make $2,900.
The data above assume we know the book price and how many copies we will sell. But we're actually not sure, so we'd like to know the revenue for different combination of price and quantity. For example: how much profit will we make if we sell 150 copies instead of 100, and what if the price is $19 or $49?
There are 2 main ways to do that:
Nobody likes doing repetitive tasks manually, so let's try the second option ;-)
Before we start using the data table, we need to do some changes to our data.
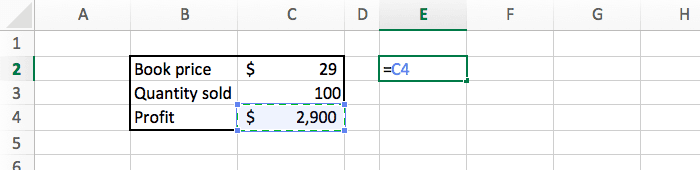
First we need to copy the formula to a separate place. You can do this by simply typing =C4 in a blank cell.
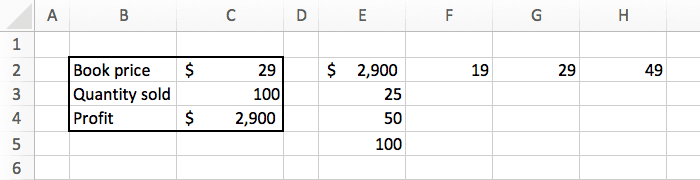
Then we need to tell Excel what values we would like to test. To the right of the formula we list all the prices ($19, $29, $49), and below the formula we list all the quantities (25, 50, 100).
And we can add some basic formatting (borders and currency) to make things look slightly better.
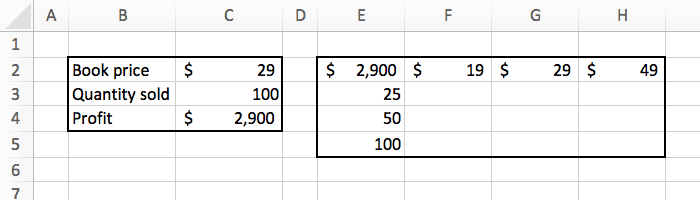
Our goal is to fill this table with the profit for each combination of price and quantity.
Now we can start the interesting part!
Select the new table we just created, and in the "data" tab, click on the "what if analysis" button. There select "data table".
A popup will appear that you need to fill like this:
Press OK, and we are done. Excel did the math for us, and automatically updated the spreadsheet with all the numbers we wanted.
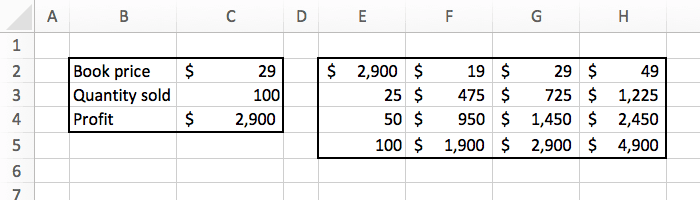
Now we can see exactly how much revenue we will make based on the different combination of inputs. For example it shows that selling 50 copies at $49 will make us $2,450. That's super powerful.
For your information, using data tables have some drawbacks. Here I listed three limitations that make me most uncomfortable:
With just a few clicks, we can get Excel to do some magic computation and give us interesting information.
For this example we had a simple formula. But you could do the same on something much more complex, and Excel will give you the perfect answer in no time.